General Tips
Using pylinac is easy! Once installed, you can write your own script in a matter of minutes.
Each module of pylinac addresses the topic of its name (e.g. the Starshot class, surprisingly, performs
starshot analysis). Furthermore, each module is designed as similarly as possible
to one another. So once you start using one module, it’s easy to use another (see Module Design).
Each module also has its own demonstration method and data to show off what it can do.
Running a Demo
Let’s get started by running a demo of the Starshot module. First, import the Starshot class:
from pylinac import Starshot
This class has all the capabilities of loading and analyzing a Starshot image. Let’s 1) create an instance of that class and then 2) run its demonstration method:
from pylinac import Starshot

Starshot.run_demo()
(Source code, png, hires.png, pdf)
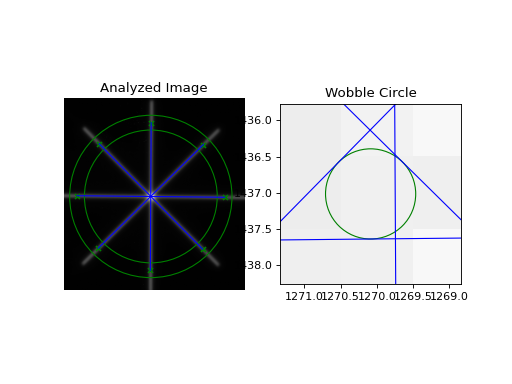
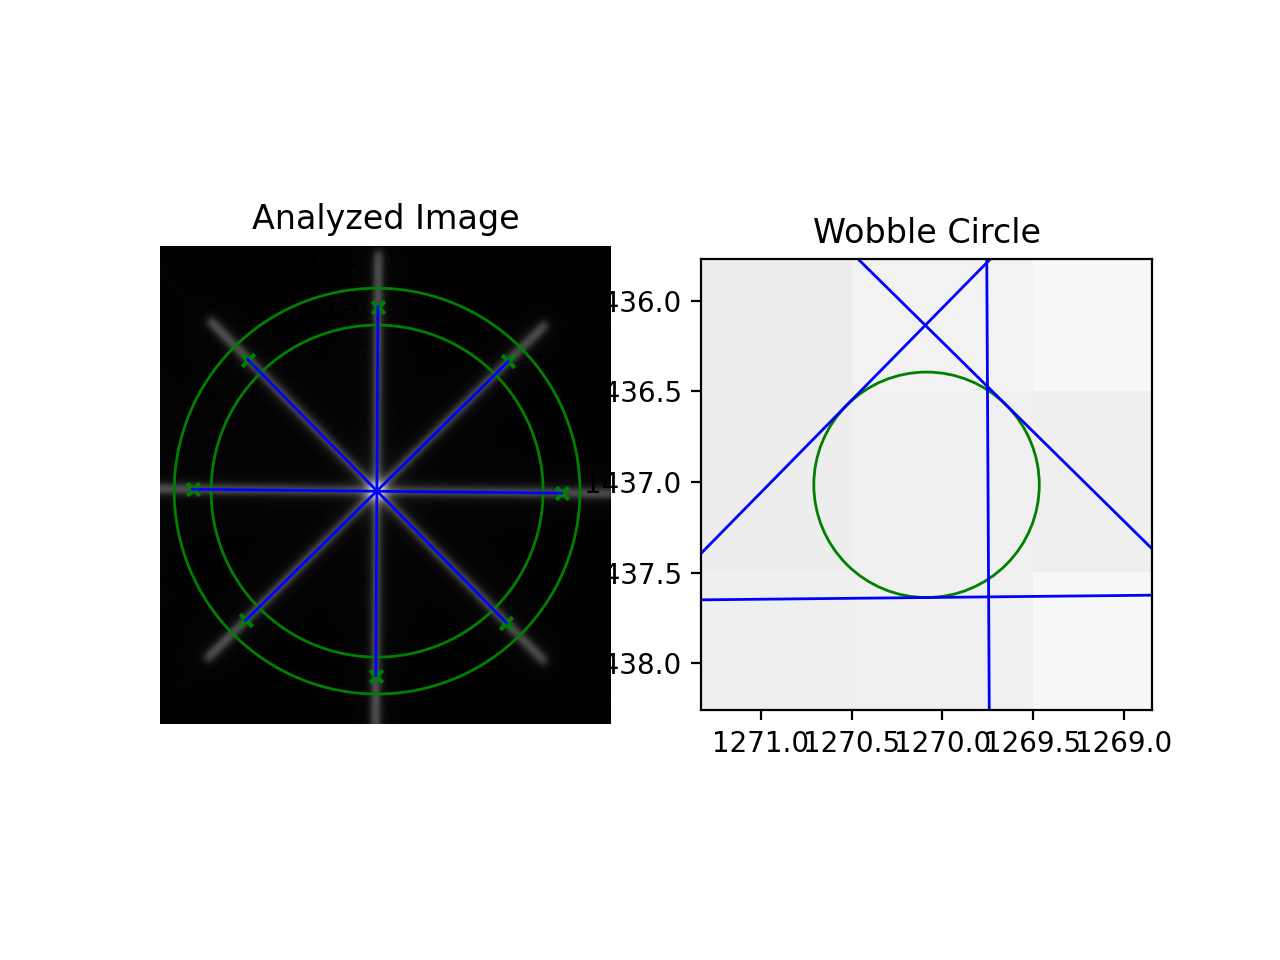
Running this should result in a printing of information to the console and an image showing the analyzed image, like so:
Result: PASS

The minimum circle that touches all the star lines has a diameter of 0.434 mm.

The center of the minimum circle is at 1270.1, 1437.1
Congratulations! In 3 lines you’ve successfully used a pylinac module. Of course there’s more to it than that; you’ll want to analyze your own images. For further documentation on starshots, see Starshot.
Loading in Images/Data
All modules have multiple ways of loading in your data. The best way to use a given module’s main class is
instantiating with the image/data file name. If you have something else (e.g. a URL or set of multiple images)
you can use the class-based constructors that always start with from_. Let’s use the log_analyzer module to demonstrate:
from pylinac import TrajectoryLog
We can pass the path to the log, and this would be the standard way of constructing:
log = TrajectoryLog(r"C:/John/QA/log.dlg")
Perhaps the data is stored online somewhere. You can load in the data from a URL:
log = TrajectoryLog.from_url("https://myserver.com/logs/log23.bin")
If for any reason you don’t have data and want to experiment, you can easily load in demo data:
tlog = TrajectoryLog.from_demo()
You can find out more about logs in the Log Analyzer. All modules are similar however; the main class can be instantiated directly, through class-based constructors, from a URL, and all main classes have a demo dataset and demo method.
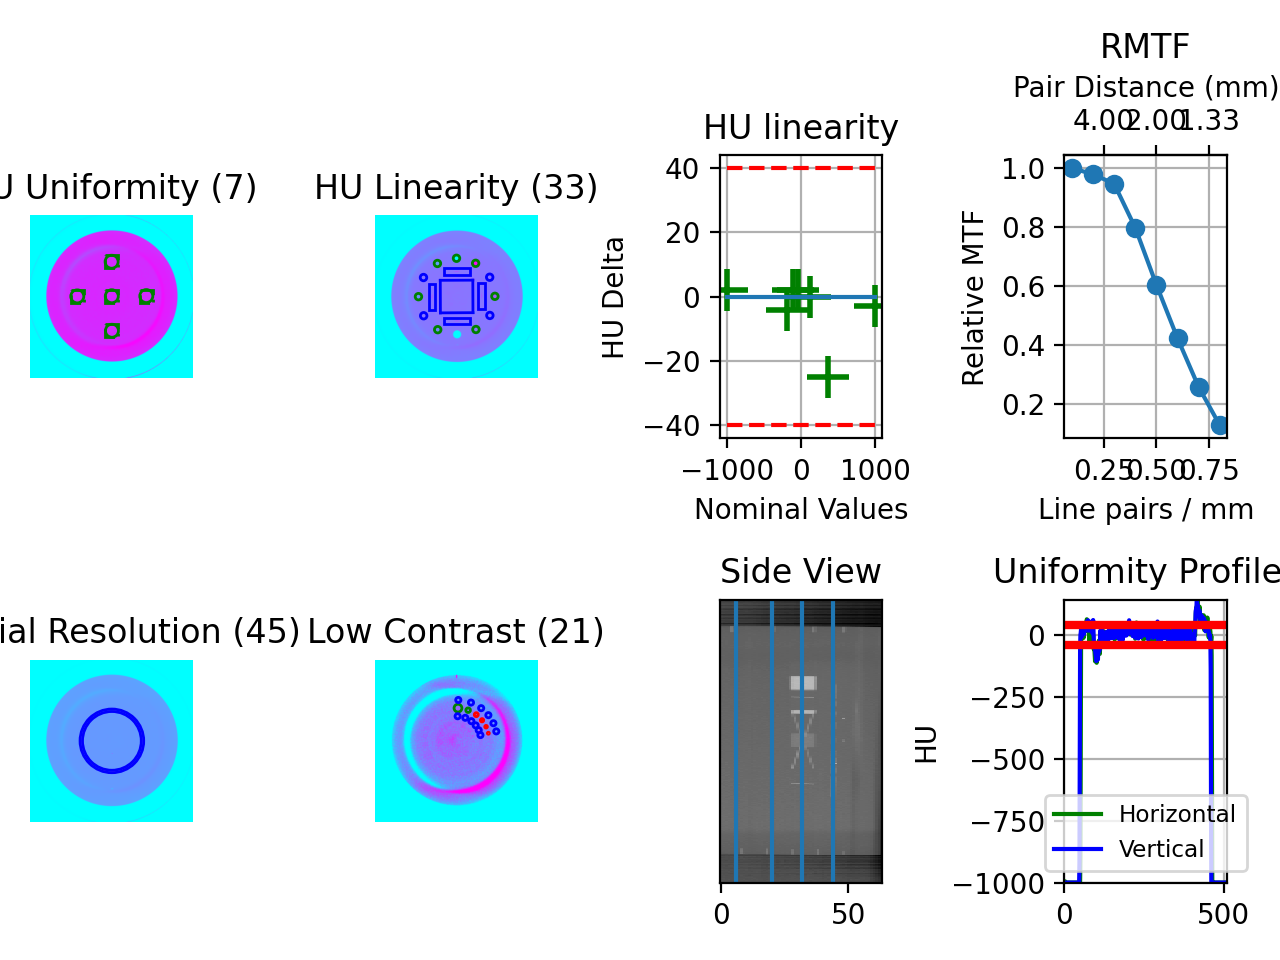
Changing Colormaps
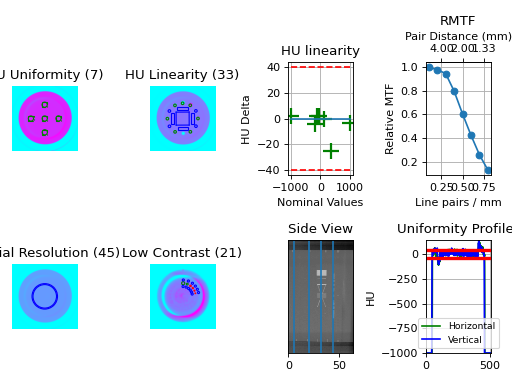
The colormaps in pylinac are pretty standard. By default, DICOM images are shown in grayscale, while most other arrays are shown in jet. Changing these is easy though. All that’s required is to pass a valid matplotlib colormap (see options here). Let’s set the DICOM plots to be ‘cool’:
import pylinac
# change the colormap setting
pylinac.settings.DICOM_COLORMAP = 'cool'
pylinac.CatPhan504.run_demo()
(Source code, png, hires.png, pdf)

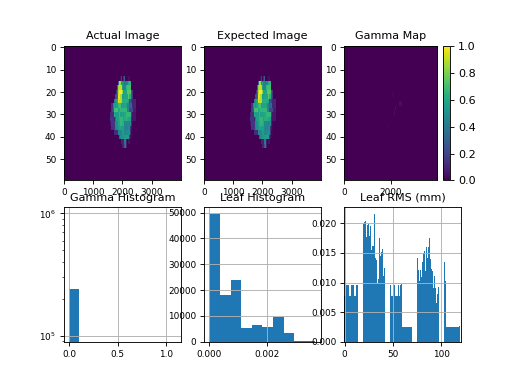
We can also change other arrays, for example the arrays in the log_analyzer module.
Let’s change it to the newer, better matplotlib default colormap, viridis:
import matplotlib.pyplot as plt
import pylinac

pylinac.settings.ARRAY_COLORMAP = plt.cm.viridis
pylinac.TrajectoryLog.run_demo()
(Source code, png, hires.png, pdf)
