Starshot
Overview
The Starshot module analyses a starshot image made of radiation spokes, whether gantry, collimator, MLC or couch. It is based on ideas from Depuydt et al and Gonzalez et al.
Features:
Analyze scanned film images, single EPID images, or a set of EPID images - Any image that you can load in can be analyzed, including 1 or a set of EPID DICOM images and films that have been digitally scanned.
Any image size - Have machines with different EPIDs? Scanned your film at different resolutions? No problem.
Dose/OD can be inverted - Whether your device/image views dose as an increase in value or a decrease, pylinac will detect it and invert if necessary.
Automatic noise detection & correction - Sometimes there’s dirt on the scanned film; sometimes there’s a dead pixel on the EPID. Pylinac will detect these spurious noise signals and can avoid or account for them.
Accurate, FWHM star line detection - Pylinac uses not simply the maximum value to find the center of a star line, but analyzes the entire star profile to determine the center of the FWHM, ensuring small noise or maximum value bias is avoided.
Adaptive searching - If you passed pylinac a set of parameters and a good result wasn’t found, pylinac can recover and do an adaptive search by adjusting parameters to find a “reasonable” wobble.
Running the Demo
To run the Starshot demo, create a script or start an interpreter and input:
from pylinac import Starshot

Starshot.run_demo()
(Source code, png, hires.png, pdf)
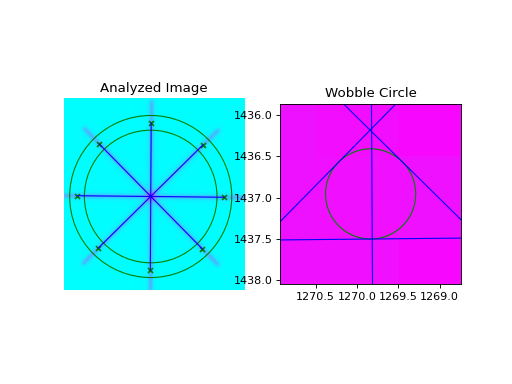
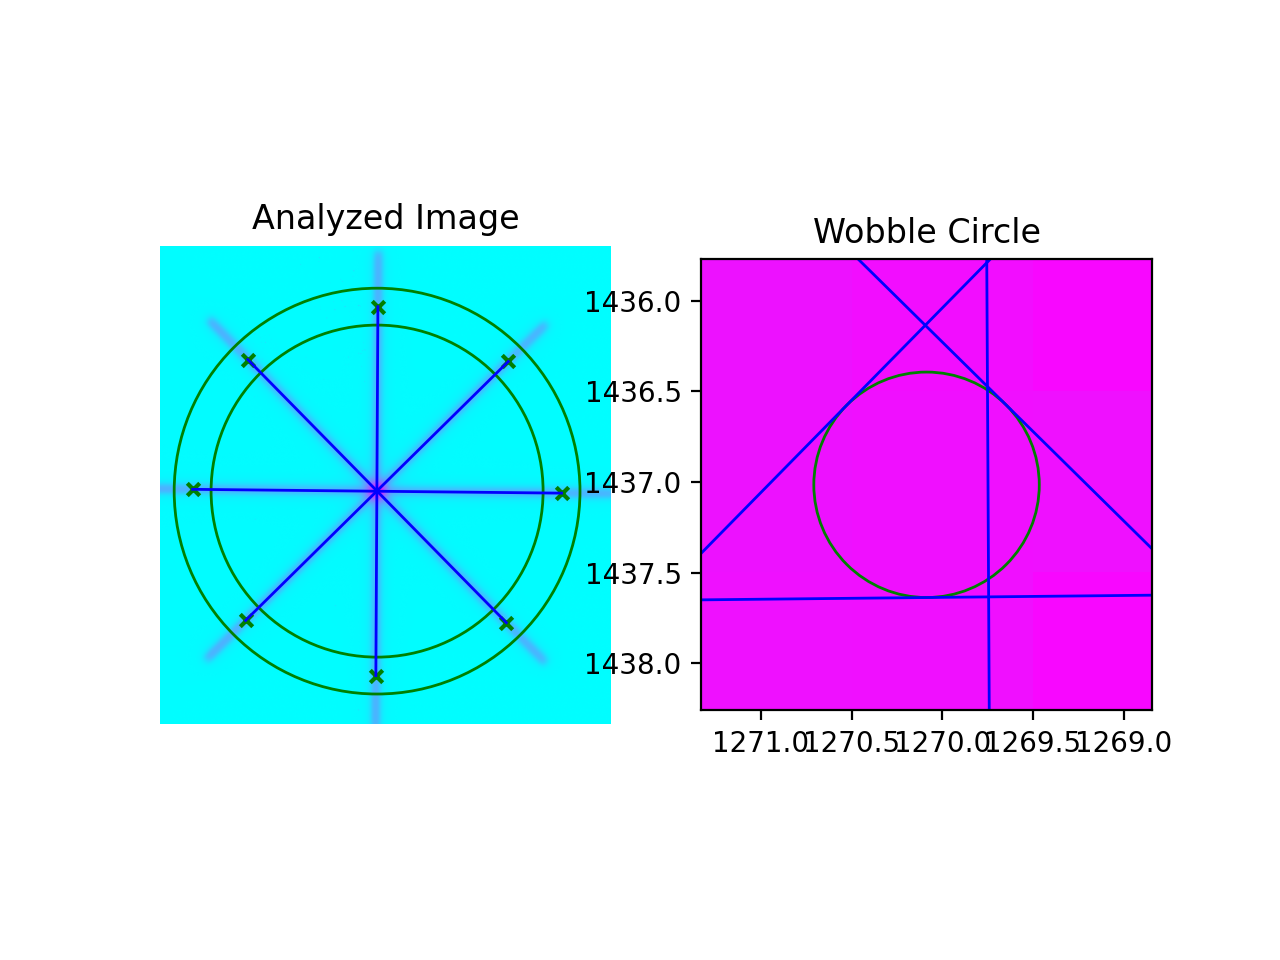
Results will be printed to the console and a matplotlib figure showing the analyzed starshot image will pop up:
Result: PASS

The minimum circle that touches all the star lines has a diameter of 0.381 mm.

The center of the minimum circle is at 1270.0, 1437.2
Image Acquisition
To capture starshot images, film is often used, but a sequence of EPID images can also work for collimator measurements. Pylinac can automatically superimpose the images. See the literature mentioned in the Overview for more info on acquisition.
Typical Use
The Starshot analysis can be run first by importing the Starshot class:
from pylinac import Starshot
A typical analysis sequence looks like so:
Load image(s) – Loading film or superimposed EPID DICOM images can be done by passing the file path or by using a UI to find and get the file. The code might look like any of the following:
star_img = "C:/QA Folder/gantry_starshot.tif"
mystar = Starshot(star_img)
Multiple images can be easily superimposed and used; e.g. collimator shots at various angles:
star_imgs = ["path/star0.tif", "path/star45.tif", "path/star90.tif"]
mystar = Starshot.from_multiple_images(star_imgs)
Analyze the image – After loading the image, all that needs to be done is analyze the image. You may optionally pass in some settings:
mystar.analyze(radius=0.5, tolerance=0.8) # see API docs for more parameter info
View the results – Starshot can print out the summary of results to the console as well as draw a matplotlib image to show the detected radiation lines and wobble circle:
# print results to the console
print(mystar.results())
# view analyzed image
mystar.plot_analyzed_image()
Additionally, the data can be accessed through a convenient
StarshotResultsclass which comes in useful when using pylinac through an API or for passing data to other scripts/routines.# return a dataclass with introspection data = mystar.results_data() data.tolerance_mm data.passed ... # return as a dict data_dict = mystart.results_data(as_dict=True) data_dict["passed"] ...
Each subplot can be plotted independently as well:
# just the wobble plot
mystar.plot_analyzed_subimage("wobble")
# just the zoomed-out plot
mystar.plot_analyzed_subimage("whole")
Saving the images is also just as easy:
mystar.save_analyzed_image("mystar.png")
You may also save to PDF:
mystar.publish_pdf("mystar.pdf")
Analysis Parameters
See analyze() for details.
Image dots per inch: The DPI of the image. Only needed for TIFF images and only if the resolution tag is not in the TIFF tags.
Source to film distance: The distance from the radiation source to the film in mm. Only needed for TIFF images.
Normalized Radius: The radius of the circle used to detect the spokes. 0 is the center of the spoke intersection and 1 is the extent of the “shortest” detected spoke. E.g. the spokes may be partially cut off from the image edge.
Tolerance: The isocenter diameter tolerance in mm.
Normalized minimum peak height: The percentage minimum height a peak must be to be considered a valid peak. A lower value catches radiation peaks that vary in magnitude (e.g. different MU delivered or gantry shot), but could also pick up noise. If necessary, lower value for gantry shots and increase for noisy images.
Algorithm
Allowances
The image can be either inversion (radiation is darker or brighter).
The image can be any size.
The image can be DICOM (from an EPID) or most image formats (scanned film).
If multiple images are used, they must all be the same size.
Restrictions
Warning
Analysis can fail or give unreliable results if any Restriction is violated.
The image must have at least 6 spokes (3 angles).
The center of the “star” must be in the central 1/3 of the image.
The radiation spokes must extend to both sides of the center. I.e. the spokes must not end at the center of the circle.
Markings like pin pricks or marker dots can cause wild pixel values and analysis errors and should be cropped out if possible.
Pre-Analysis
Ground – The image is “grounded” by setting the lowest pixel value to 0. This is done to avoid issues with high-background pixel values.
Check image inversion – The image is checked for proper inversion using histogram analysis.
Set algorithm starting point – If the user provided a
start_pointto theanalyzemethod, this value is used. Otherwise, the start point is automatically found by examining the central 1/3 of the image and taking the max of that image window along each axis and finding the center of the full-width, 80%-max of each profile.
Analysis
Extract circle profile – A circular profile is extracted from the image centered around the starting point and at the radius given.
Find spokes – The circle profile is analyzed for peaks (either simple peaks or FWHM peaks depending on the
fwhmparameter). An even number of spokes (1 for each side; e.g. 3 collimator angles should produce 6 spokes, one for each side of the CAX) and at least 6 spokes (3 angles) must be found or an error is raised. Ifrecursiveis set to true, this process is repeated for the radii range 0.1-0.95 and from 0.05-0.95min_peak_height. If no combination of these parameters produces a valid set of spokes, an error is raised.Match peaks – Peaks are matched to their counterparts opposite the CAX to compose a line using a simple peak number offset. After matching, the distances from the lines to the start point is measured. If the distance is greater than 10mm of any line, an error is raised and follows the same logic regarding
recursiveas the previous step. This is to avoid issues specifically with gantry starshots. This can also be corrected ahead of time by using a lowermin_peak_height.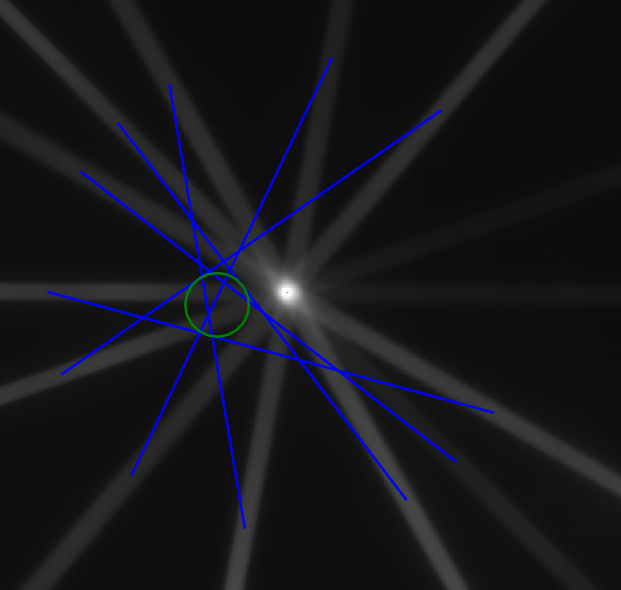
The above image has an even number of spokes, but has not caught the low-dose end of the gantry spokes on the right.
Find wobble – Starting at the initial starting point, a Nelder-Mead gradient method is utilized to find the point of minimum distance to all lines. The wobble is assumed to be found if the wobble diameter is <2mm and is <10 mm from the starting point. If not, the same logic as the previous steps is followed regarding the
recursiveparameter.
Post-Analysis
Check if passed – Once the wobble is calculated, it is tested against the tolerance given, and passes if below the tolerance. If the image carried a pixel/mm conversion ratio, the tolerance and result are in mm, otherwise they will be in pixels.
Interpreting Results
This section explains what is returned in the results_data object.
This is also the same information that is given in the RadMachine results
section.
tolerance_mm– The tolerance used for the analysis in mm.circle_radius_mm– The radius of the minimum circle that touches all the star lines in mm.circle_diameter_mm– The diameter of the minimum circle that touches all the star lines in mm.circle_center_x_y– The center position of the minimum circle in pixels.angles– The angles of the spokes in degrees. 0 is pointing straight up. +90 is to the right; -90 is to the left. Angles are always between +/-90.passed– Whether the analysis passed or failed.
Troubleshooting
First, check the general Troubleshooting section, especially if an image won’t load. Specific to the starshot analysis, there are a few things you can do.
Set recursive to True - This easy step in
analyze()allows pylinac to search for a reasonable wobble even if the conditions you passed don’t for some reason give one.Make sure the center of the star is in the central 1/3 of the image - Otherwise, pylinac won’t find it.
Make sure there aren’t egregious artifacts - Pin pricks can cause wild pixel values; crop them out if possible.
Set ``invert`` to True - While right most of the time, it’s possible the inversion checker got it wrong. This would look like peak locations in the “valley” regions of the image. If so, pass
invert=Trueto theanalyzemethod.
Benchmarking the Algorithm
With the image generator module we can create test images to test the starshot algorithm on known results. This is useful to isolate what is or isn’t working if the algorithm doesn’t work on a given image and when commissioning pylinac.
Perfect shot
Note
Due to the rounding of pixel positions of the star lines an absolutely perfect (0.0000mm wobble) is not achievable. The uncertainty of the algorithm is ~0.05mm.
Let’s create a perfect irradiation of a starshot pattern:
from scipy import ndimage

import pylinac
from pylinac.core.image_generator import GaussianFilterLayer, FilteredFieldLayer, AS1200Image, RandomNoiseLayer


star_path = 'perfect_starshot.dcm'
as1200 = AS1200Image()
for _ in range(6):
    as1200.add_layer(FilteredFieldLayer((270, 5), alpha=0.5))
    as1200.image = ndimage.rotate(as1200.image, 30, reshape=False, mode='nearest')
as1200.add_layer(GaussianFilterLayer(sigma_mm=3))
as1200.generate_dicom(file_out_name=star_path)

# analyze it
star = pylinac.Starshot(star_path)
star.analyze()
print(star.results())
star.plot_analyzed_image()
(Source code, png, hires.png, pdf)
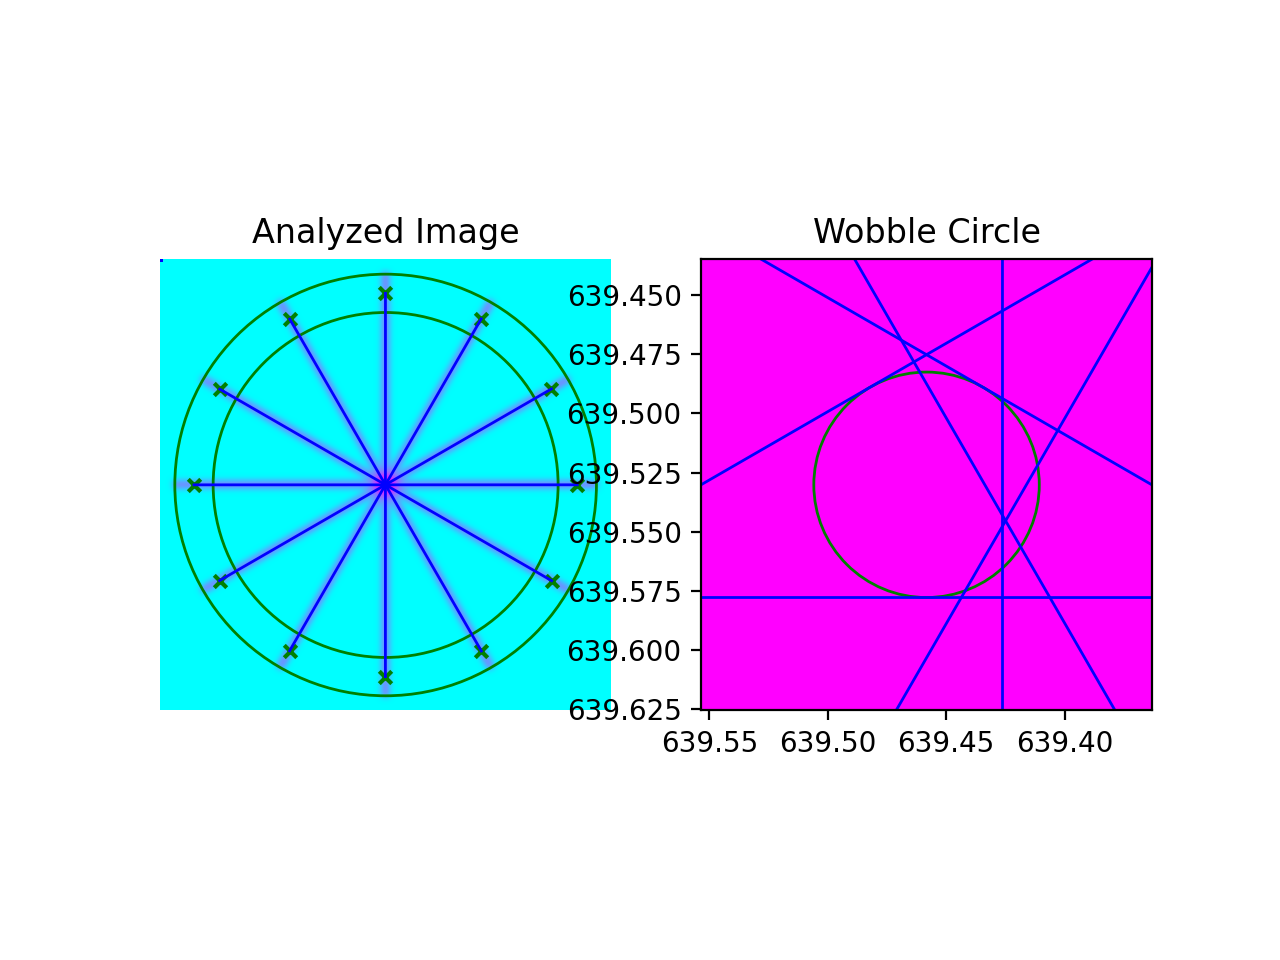
with an output of:
Result: PASS
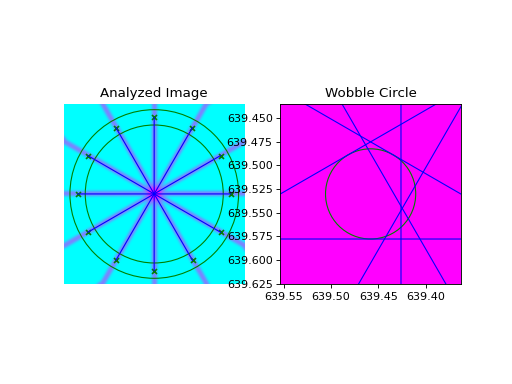
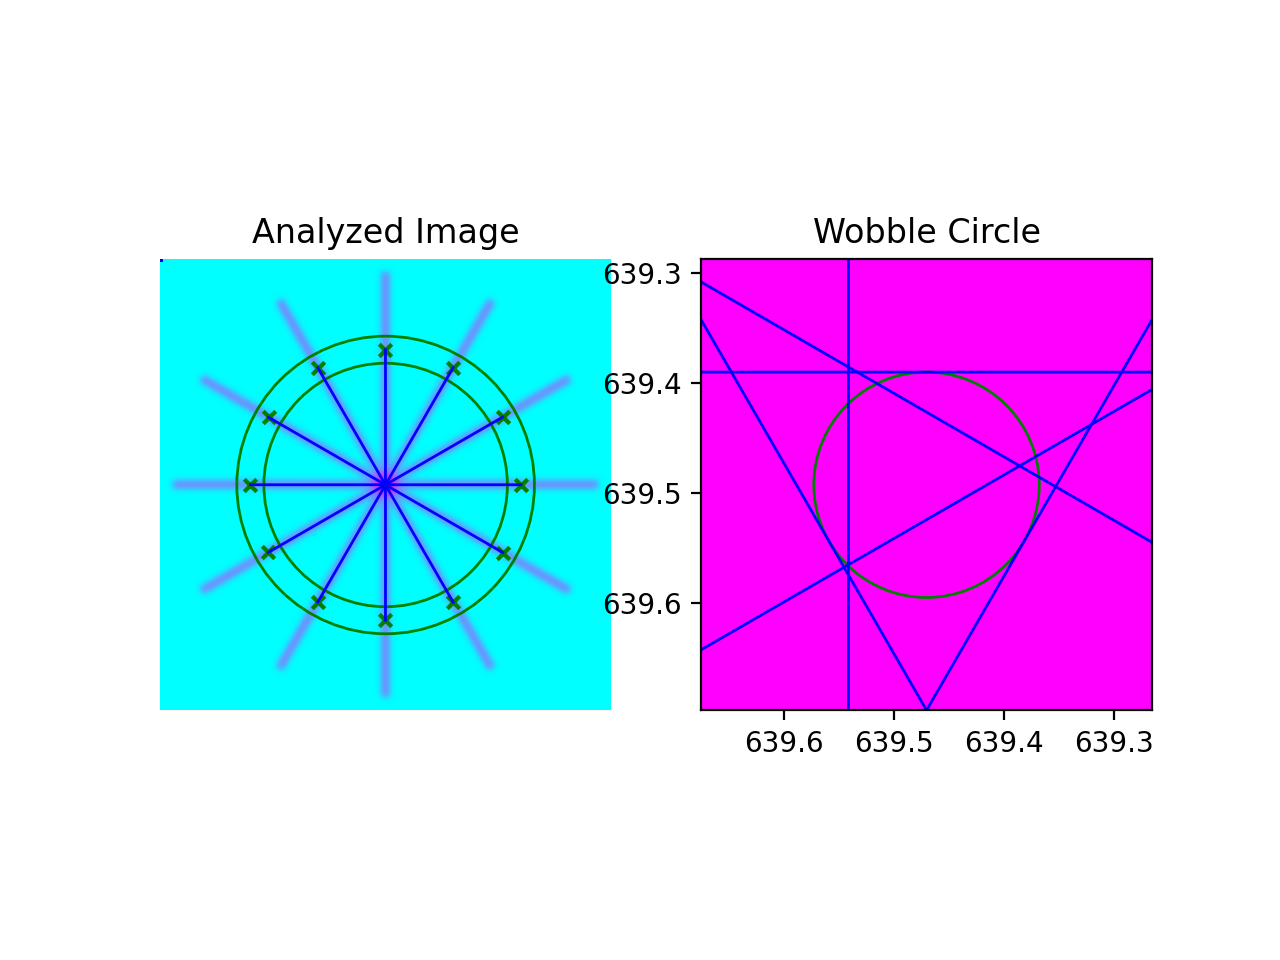
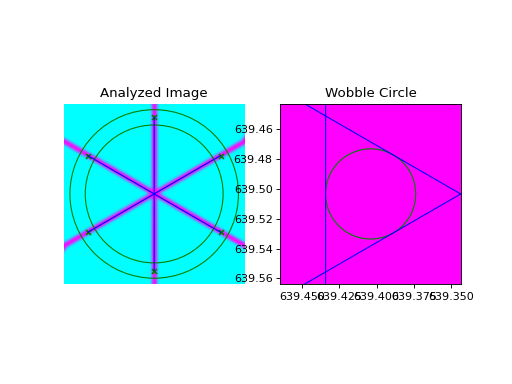
The minimum circle that touches all the star lines has a diameter of 0.045 mm.
The center of the minimum circle is at 639.5, 639.5
Note that there is still an identified wobble of ~0.045mm due to pixel position rounding of the generated image star lines. The center of the star is dead on at 639.5 (AS1200 image of shape 1278 and going to the middle of the pixel).
We can also evaluate the effect of changing the radius:
from scipy import ndimage

import pylinac
from pylinac.core.image_generator import GaussianFilterLayer, FilteredFieldLayer, AS1200Image, RandomNoiseLayer


star_path = 'perfect_starshot.dcm'
as1200 = AS1200Image()
for _ in range(6):
    as1200.add_layer(FilteredFieldLayer((270, 5), alpha=0.5))
    as1200.image = ndimage.rotate(as1200.image, 30, reshape=False, mode='nearest')
as1200.add_layer(GaussianFilterLayer(sigma_mm=3))
as1200.generate_dicom(file_out_name=star_path)

# analyze it
star = pylinac.Starshot(star_path)
star.analyze(radius=0.6)  # radius changed
print(star.results())
star.plot_analyzed_image()
(Source code, png, hires.png, pdf)

which results in:
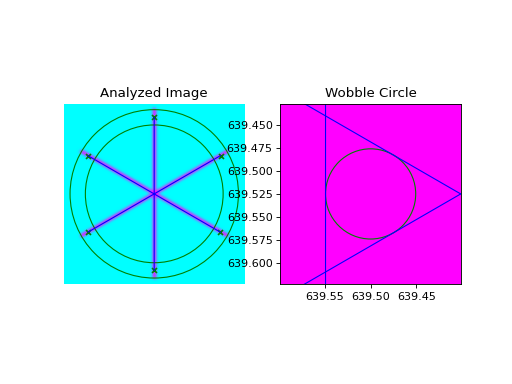
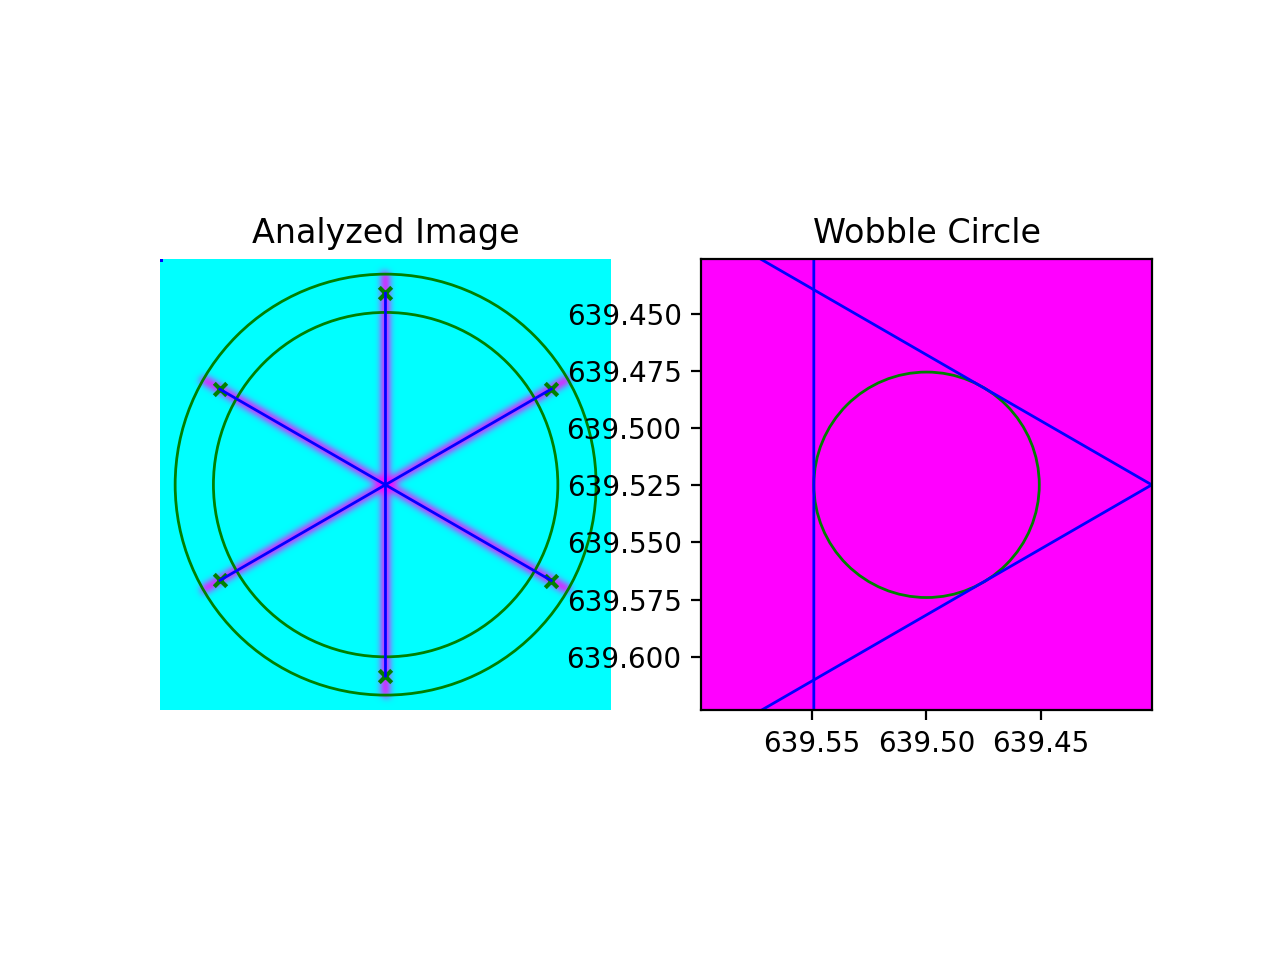
Result: PASS

The minimum circle that touches all the star lines has a diameter of 0.036 mm.

The center of the minimum circle is at 639.5, 639.5
The center hasn’t moved but we do have a diameter of ~0.03mm now. Again, this is a limitation of both the algorithm and image generation.
Offset
We can also generate an offset starshot:
Note
This image is completely generated and depending on the angle and number of spokes, this result may change due to the fragility of rotating the image.
from scipy import ndimage

import pylinac
from pylinac.core.image_generator import GaussianFilterLayer, FilteredFieldLayer, AS1200Image, RandomNoiseLayer


star_path = 'offset_starshot.dcm'
as1200 = AS1200Image()
for _ in range(6):
    as1200.add_layer(FilteredFieldLayer((270, 5), alpha=0.5, cax_offset_mm=(1, 1)))
    as1200.image = ndimage.rotate(as1200.image, 60, reshape=False, mode='nearest')
as1200.add_layer(GaussianFilterLayer(sigma_mm=3))
as1200.generate_dicom(file_out_name=star_path)

# analyze it
star = pylinac.Starshot(star_path)
star.analyze()
print(star.results())
star.plot_analyzed_image()
(Source code, png, hires.png, pdf)
with an output of:
Result: FAIL

The minimum circle that touches all the star lines has a diameter of 1.035 mm.

The center of the minimum circle is at 637.8, 633.3
Note that we still have the 0.035mm error from the algorithm uncertainty but that we have caught the 1mm offset appropriately.
API Documentation
- class pylinac.starshot.Starshot(filepath: str | BinaryIO, **kwargs)[source]
Bases:
ResultsDataMixin[StarshotResults],QuaacMixinClass that can determine the wobble in a “starshot” image, be it gantry, collimator, couch or MLC. The image can be a scanned film (TIF, JPG, etc) or a sequence of EPID DICOM images.
Attributes
image :
Imagecircle_profile :StarProfilelines :LineManagerwobble :Wobbletolerance :ToleranceExamples
- Run the demo:
>>> Starshot.run_demo()
- Typical session:
>>> img_path = r"C:/QA/Starshots/Coll.jpeg"
>>> mystar = Starshot(img_path, dpi=105, sid=1000)
>>> mystar.analyze()
>>> print(mystar.results())
>>> mystar.plot_analyzed_image()
Parameters
- filepath
The path to the image file.
- kwargs
Passed to
load().
- classmethod from_url(url: str, **kwargs)[source]
Instantiate from a URL.
Parameters
- urlstr
URL of the raw file.
- kwargs
Passed to
load().
- classmethod from_multiple_images(filepath_list: list, stretch_each: bool = True, method: str = 'sum', **kwargs)[source]
Construct a Starshot instance and load in and combine multiple images.
Parameters
- filepath_listiterable
An iterable of file paths to starshot images that are to be superimposed.
- stretch_eachbool
Whether to stretch each image individually before combining. See
load_multiples.- method{‘sum’, ‘mean’}
The method to combine the images. See
load_multiples.- kwargs
Passed to
load_multiples().
- classmethod from_zip(zip_file: str, **kwargs)[source]
Construct a Starshot instance from a ZIP archive.
Parameters
- zip_filestr
Points to the ZIP archive. Can contain a single or multiple images. If multiple images the images are combined and thus should be from the same test sequence.
- kwargs
Passed to
load_multiples().
- analyze(radius: float = 0.85, min_peak_height: float = 0.25, max_wobble_diameter: float = 2.0, tolerance: float = 1.0, start_point: Point | tuple | None = None, fwhm: bool = True, recursive: bool = True, invert: bool = False)[source]
Analyze the starshot image.
Analyze finds the minimum radius and center of a circle that touches all the lines (i.e. the wobble circle diameter and wobble center).
Parameters
- radiusfloat, optional
Distance in % between starting point and closest image edge; used to build the circular profile which finds the radiation lines. Must be between 0.05 and 0.95.
- min_peak_heightfloat, optional
The percentage minimum height a peak must be to be considered a valid peak. A lower value catches radiation peaks that vary in magnitude (e.g. different MU delivered or gantry shot), but could also pick up noise. If necessary, lower value for gantry shots and increase for noisy images.
- max_wobble_diameter: float, optional
Max wobble diameter in mm. Used only when
recursive=True, and in that case a larger value results in an unreasonable wobble.- toleranceint, float, optional
The tolerance in mm to test against for a pass/fail result.
- start_point2-element iterable, optional
The point where the algorithm should center the circle profile, given as (x-value, y-value). If None (default), will search for a reasonable maximum point nearest the center of the image.
- fwhmbool
If True (default), the center of the FWHM of the spokes will be determined. If False, the peak value location is used as the spoke center.
Note
In practice, this ends up being a very small difference. Set to false if peak locations are offset or unexpected.
- recursivebool
If True (default), will recursively search for a “reasonable” wobble, meaning the wobble radius is less than max_wobble_diameter If the wobble found was unreasonable, the minimum peak height is iteratively adjusted from low to high at the passed radius. If for all peak heights at the given radius the wobble is still unreasonable, the radius is then iterated over from most distant inward, iterating over minimum peak heights at each radius. If False, will simply return the first determined value or raise error if a reasonable wobble could not be determined.
Warning
It is strongly recommended to leave this setting at True.
- invertbool
Whether to force invert the image values. This should be set to True if the automatically-determined pylinac inversion is incorrect.
Raises
- RuntimeError
If a reasonable wobble value was not found.
- property passed: bool
Boolean specifying whether the determined wobble was within tolerance.
- results(as_list: bool = False) str | list[str][source]
Return the results of the analysis.
Parameters
- as_listbool
Whether to return as a list of strings vs single string. Pretty much for internal usage.
- plotly_analyzed_images(show: bool = True, show_colorbar: bool = True, show_legend: bool = True, **kwargs) dict[str, Figure][source]
Plot the analyzed set of images to Plotly figures. Will plot a zoomed-out image and a zoomed-in image.
Parameters
- showbool
Whether to show the plot.
- show_colorbarbool
Whether to show the colorbar on the plot.
- show_legendbool
Whether to show the legend on the plot.
- kwargs
Additional keyword arguments to pass to the plot.
Returns
- dict
A dictionary of the Plotly figures where the key is the name of the image and the value is the figure.
- plot_analyzed_image(show: bool = True, **plt_kwargs: dict)[source]
Draw the star lines, profile circle, and wobble circle on a matplotlib figure.
Parameters
- showbool
Whether to actually show the image.
- plt_kwargsdict
Keyword args passed to the plt.subplots() method. Allows one to set things like figure size.
- plot_analyzed_subimage(subimage: str = 'wobble', ax: Axes | None = None, show: bool = True, **plt_kwargs: dict)[source]
Plot a subimage of the starshot analysis. Current options are the zoomed out image and the zoomed in image.
Parameters
- subimagestr
If ‘wobble’, will show a zoomed in plot of the wobble circle. Any other string will show the zoomed out plot.
- axNone, matplotlib Axes
If None (default), will create a new figure to plot on, otherwise plot to the passed axes.
- showbool
Whether to actually show the image.
- plt_kwargsdict
Keyword args passed to the plt.figure() method. Allows one to set things like figure size. Only used if ax is not passed.
- save_analyzed_image(filename: str, **kwargs)[source]
Save the analyzed image plot to a file.
Parameters
- filenamestr, IO stream
The filename to save as. Format is deduced from string extention, if there is one. E.g. ‘mystar.png’ will produce a PNG image.
- kwargs
All other kwargs are passed to plt.savefig().
- save_analyzed_subimage(filename: str, subimage: str = 'wobble', **kwargs)[source]
Save the analyzed subimage to a file.
Parameters
- filenamestr, file-object
Where to save the file to.
- subimagestr
If ‘wobble’, will show a zoomed in plot of the wobble circle. Any other string will show the zoomed out plot.
- kwargs
Passed to matplotlib.
- publish_pdf(filename: str | BinaryIO, notes: str | list[str] | None = None, open_file: bool = False, metadata: dict | None = None, logo: Path | str | None = None)[source]
Publish (print) a PDF containing the analysis, images, and quantitative results.
Parameters
- filename(str, file-like object}
The file to write the results to.
- notesstr, list of strings
Text; if str, prints single line. If list of strings, each list item is printed on its own line.
- open_filebool
Whether to open the file using the default program after creation.
- metadatadict
Extra data to be passed and shown in the PDF. The key and value will be shown with a colon. E.g. passing {‘Author’: ‘James’, ‘Unit’: ‘TrueBeam’} would result in text in the PDF like: ————– Author: James Unit: TrueBeam ————–
- logo: Path, str
A custom logo to use in the PDF report. If nothing is passed, the default pylinac logo is used.
- clear_captured_warnings() None
Clear the list of captured warnings.
- get_captured_warnings() list[dict]
Retrieve the list of captured warnings, deduplicated.
- results_data(as_dict: bool = False, as_json: bool = False, by_alias: bool = False, exclude: set[str] | None = None) T | dict | str
Present the results data and metadata as a dataclass, dict, or tuple. The default return type is a dataclass.
Parameters
- as_dictbool
If True, return the results as a dictionary.
- as_jsonbool
If True, return the results as a JSON string. Cannot be True if as_dict is True.
- by_aliasbool
If True, use the alias names of the dataclass fields. These are generally the more human-readable names.
- excludeset
A set of fields to exclude from the results data.
- to_quaac(path: str | Path, performer: User, primary_equipment: Equipment, format: Literal['json', 'yaml'] = 'yaml', attachments: list[Attachment] | None = None, overwrite: bool = False, **kwargs) None
Write an analysis to a QuAAC file. This will include the items from results_data() and the PDF report.
Parameters
- pathstr, Path
The file to write the results to.
- performerUser
The user who performed the analysis.
- primary_equipmentEquipment
The equipment used in the analysis.
- format{‘json’, ‘yaml’}
The format to write the file in.
- attachmentslist of Attachment
Additional attachments to include in the QuAAC file.
- overwritebool
Whether to overwrite the file if it already exists.
- kwargs
Additional keyword arguments to pass to the Document instantiation.
- pydantic model pylinac.starshot.StarshotResults[source]
Bases:
ResultBaseThis class should not be called directly. It is returned by the
results_data()method. It is a dataclass under the hood and thus comes with all the dunder magic.Use the following attributes as normal class attributes.
Create a new model by parsing and validating input data from keyword arguments.
Raises [ValidationError][pydantic_core.ValidationError] if the input data cannot be validated to form a valid model.
self is explicitly positional-only to allow self as a field name.
- field tolerance_mm: float [Required]
The tolerance used for the analysis in mm.
- field circle_diameter_mm: float [Required]
The diameter of the minimum circle that touches all the star lines in mm.
- field circle_radius_mm: float [Required]
The radius of the minimum circle that touches all the star lines in mm.
- field circle_center_x_y: tuple[float, float] [Required]
The center position of the minimum circle in pixels.
- field angles: list[float] [Required]
The angles of the radiation lines in degrees. The angles are relative to the vertical axis and range from +/- 90 degrees.
- field passed: bool [Required]
Whether the analysis passed or failed.
- class pylinac.starshot.StarProfile(image, start_point, radius, min_peak_height, fwhm)[source]
Bases:
CollapsedCircleProfileClass that holds and analyzes the circular profile which finds the radiation lines.
Parameters
- width_ratiofloat
The “thickness” of the band to sample. The ratio is relative to the radius. E.g. if the radius is 20 and the width_ratio is 0.2, the “thickness” will be 4 pixels.
- num_profilesint
The number of profiles to sample in the band. Profiles are distributed evenly within the band.
See Also
CircleProfile: Further parameter info.
- class pylinac.starshot.Wobble(center_point=None, radius=None)[source]
Bases:
CircleA class that holds the wobble information of the Starshot analysis.
Attributes
radius_mm : The radius of the Circle in mm.
Parameters
- center_pointPoint, optional
Center point of the wobble circle.
- radiusfloat, optional
Radius of the wobble circle.
- property diameter_mm: float
Diameter of the wobble in mm.
- class pylinac.starshot.LineManager(points: list[Point], focus_point: Point, dpmm: float)[source]
Bases:
objectManages the radiation lines found.
Parameters
- points :
The peak points found by the StarProfile
- construct_rad_lines(points: list[Point])[source]
- Find and match the positions of peaks in the circle profile (radiation lines)
and map their positions to the starshot image.
Radiation lines are found by finding the FWHM of the radiation spokes, then matching them to form lines.
Returns
- lineslist
A list of Lines (radiation lines) found.
See Also
Starshot.analyze() : min_peak_height parameter info core.profile.CircleProfile.find_FWXM_peaks : min_peak_distance parameter info. geometry.Line : returning object
- match_points(points: list[Point])[source]
Match the peaks found to the same radiation lines.
Peaks are matched by connecting the existing peaks based on an offset of peaks. E.g. if there are 12 peaks, there must be 6 radiation lines. Furthermore, assuming star lines go all the way across the CAX, the 7th peak will be the opposite peak of the 1st peak, forming a line. This method is robust to starting points far away from the real center.